

Do you really understand the fatigue strength of metal materials?
Aug 01, 2024
Leave a message
I. Phenomena and Characteristics of Metal Fatigue
1. Phenomena of Metal Fatigue
Crack Formation: Under alternating stress or cyclic strain, metal materials gradually form tiny cracks in areas of local high stress.
Crack Propagation: These tiny cracks gradually expand over time under continued stress.
Fracture Failure: When the cracks propagate to a certain extent, the remaining material can no longer bear the load, leading to complete fracture of the metal component.
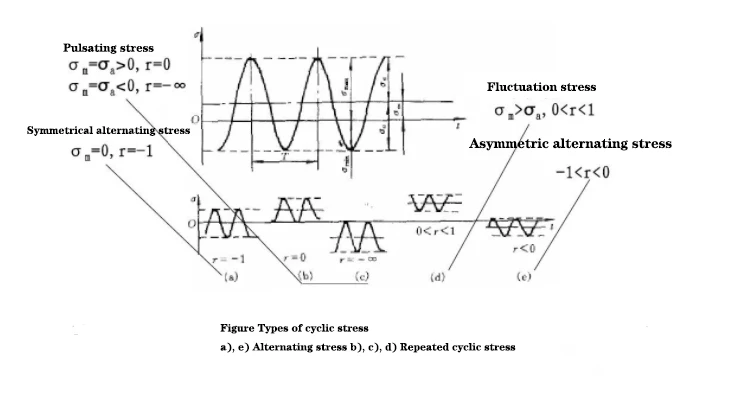
▲Figure 1 Common Cyclic Stresses
2. Characteristics of Metal Fatigue
Suddenness: Metal fatigue failure often occurs suddenly over time and is not easily detected in advance.
Locality: Failure usually occurs in areas of local high stress, with relatively concentrated locations.
Sensitivity: Metal fatigue is sensitive to environmental factors and defects. For example, surface roughness, oxidation degree, and corrosion conditions of parts can all affect fatigue strength.
Cycle Dependence: Metal fatigue is directly related to the stress level of cyclic loads and the number of cycles. Even if the stress level is below the yield strength of the material, long-term cyclic loading can still lead to fatigue failure.
Statistical Nature: According to statistics, about 80%-90% of engineering structure failures are caused by metal fatigue.
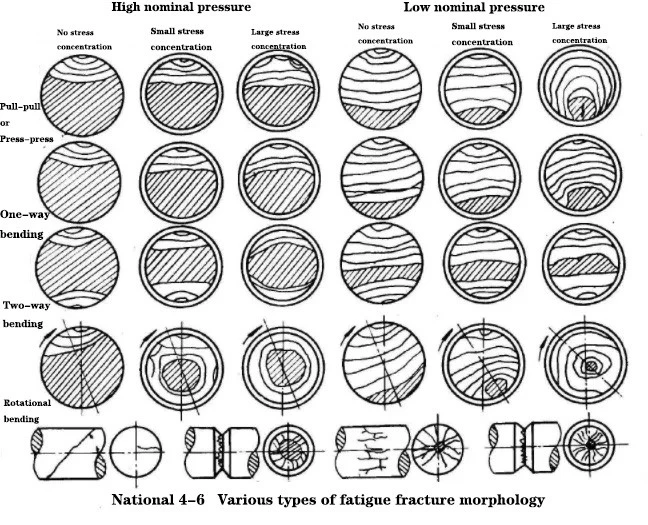
▲Various types of fatigue fracture morphology
II Classification of Metal Fatigue
1. Classification by Number of Cyclic Loads
High-Cycle Fatigue: Refers to fatigue under low stress (working stress below the material's yield limit, and even below the elastic limit) with stress cycles exceeding 100,000. This is the most common type of fatigue failure, also known as stress fatigue. High-cycle fatigue performance is described by the S-N curve (stress-life curve), which shows that for a given stress ratio, the lower the stress, the longer the life.
Low-Cycle Fatigue: Refers to fatigue under high stress (working stress close to the material's yield limit) or high strain conditions with stress cycles below 10,000 to 100,000. Because alternating plastic strain plays a major role in this type of fatigue failure, it is also called plastic fatigue or strain fatigue.
2. Classification by Form of Fatigue Failure
Thermal Fatigue: Fatigue failure caused by repeated thermal stress due to temperature changes.
Corrosion Fatigue: Fatigue failure of machine parts under the combined action of alternating loads and corrosive media (such as acids, alkalis, seawater, active gases, etc.).
Contact Fatigue: Refers to the fatigue failure of the contact surfaces of machine parts, where pitting or surface crushing and peeling occur under repeated contact stress, leading to component failure.
III. Fatigue Curve
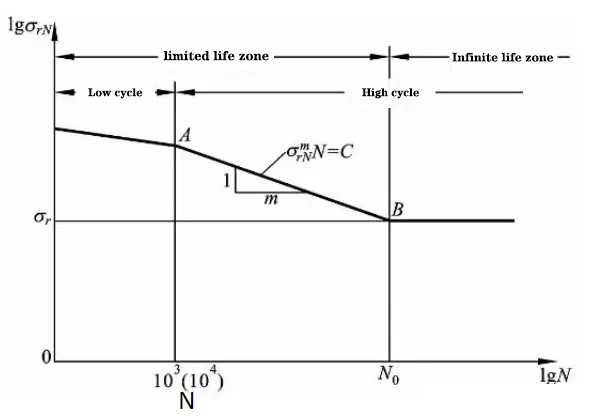
▲Fatigue Curve of Metal Materials
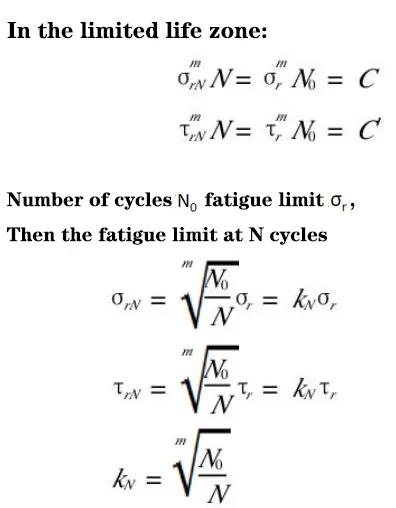
▲S-N curve
The above diagram illustrates the relationship between fatigue stress and fatigue life, known as the S-N curve, which is used to determine the fatigue limit and establish the basis for fatigue stress criteria.
Fatigue Limit: Refers to the strength indicator of a material's ability to withstand an infinite number of stress cycles without fracturing; conditional fatigue limit refers to the strength indicator of a material's ability to withstand a finite number of stress cycles without fracturing. Both are collectively referred to as fatigue strength. The greater the tensile strength, the greater the fatigue limit.
IV. Factors Affecting the Fatigue Strength of Metal Materials
1. Shape and Size of the Component
Actual mechanical parts inevitably have different forms of notches, such as steps, keyways, threads, and oil holes, which cause stress concentration and affect fatigue strength.
The size effect of the parts is also an important consideration. Larger parts compared to smaller samples may have more stress concentrations and stress gradients, affecting fatigue performance.
2. Surface Finish
Low surface finish can cause stress concentration on the material surface, thereby reducing the material's fatigue strength. For example, rough machining (rough turning) compared to longitudinal fine polishing can reduce the fatigue limit by 10% to 20% or more.
3. Service Conditions
The working environment, such as the presence of corrosive media, can infiltrate microcracks and promote fatigue failure of components.
Aerospace materials used in complex climatic conditions, such as high temperature, high humidity, and low temperature, can also affect their fatigue performance.
4. Composition of the Material
The composition of the metal material directly affects its fatigue performance. For example, an increase in carbon content reduces the fracture strength of martensite and increases the tendency to quench cracks.
5. Organizational State
The microstructure of metal materials has a significant impact on their fatigue strength. The structure obtained after quenching and tempering can further improve fatigue strength.
6. Purity
Defects such as inclusions in the material can become fatigue sources, reducing fatigue strength.
7. Residual Stress
The presence of residual stress can also affect the fatigue performance of the material.
8. Strength and Plasticity of the Material
The better the strength and plasticity of the metal material, the higher its ability to resist fatigue failure.
9. Stress Amplitude
The magnitude of the stress amplitude directly affects the fatigue life of the metal.
10. Mean Stress
The magnitude and nature (tensile or compressive) of the mean stress also affect the fatigue performance of the metal.
11. Number of Cycles
Metal fatigue failure usually occurs after a certain number of cycles.
12. Stress Concentration Effect
Sudden changes in the contour of the part or internal discontinuities (such as pores, inclusions, cracks, etc.) can become sources of stress concentration, accelerating the fatigue failure process.
V Methods for Determining Fatigue Curves
The method for determining fatigue curves, particularly the S-N curve, is a crucial approach to evaluating the fatigue performance of materials under cyclic stress or strain.
1. Determining the Test Purpose and Conditions
Clearly define the type of material to be tested, the range of stress levels, frequency, and other parameters.
Select appropriate testing equipment, such as a fatigue testing machine, and adjust and calibrate it according to test requirements.
2. Preparing the Specimens
Prepare specimens that meet the requirements based on relevant standards and test requirements.
Accurately measure and record the dimensions, weight, and other parameters of the specimens.
3. Mounting the Specimens
Install the specimen on the fatigue testing machine, ensuring alignment between the specimen axis and the loading axis.
For tests requiring special fixtures or devices, install and adjust them according to requirements.
4. Setting Test Parameters
Based on the test purpose and conditions, set loading waveform (e.g., sine wave, square wave), load level, frequency, and other parameters.
For tests that need to simulate actual working conditions, set corresponding environmental parameters such as temperature and humidity.
5. Starting the Test and Recording Data
Start the testing machine and begin cyclic loading.
During the test, record data such as load, displacement, and time for each cycle.
Monitor the deformation and failure of the specimen, and timely record the number and forms of fatigue failures.
6. Plotting the S-N Curve
Based on the test data, plot the S-N curve with stress level (S) as the horizontal axis and the logarithm of fatigue life (N, i.e., the number of cycles) as the vertical axis.
The S-N curve typically consists of three sections: the low-cycle fatigue region, the finite-life fatigue region, and the high-cycle fatigue region. These sections can be divided and labeled according to the test data.
7. Data Analysis and Interpretation
Analyze the S-N curve data, including calculations and comparisons of parameters such as slope and intercept.
Interpret the fatigue performance and life characteristics of the material based on the shape and parameters of the S-N curve.
Combine information on the material's microstructure and chemical composition to analyze the mechanisms and influencing factors of fatigue failure.